
Figure 5. The initial rate of change and phase II time constants of  for two repeated high-intensity bouts.
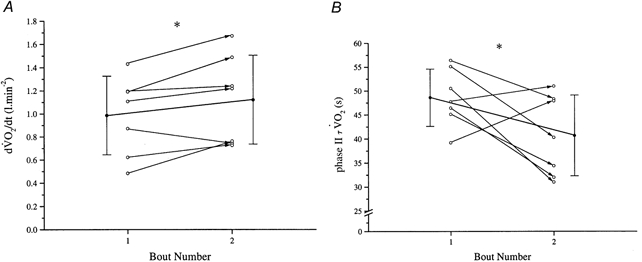
A, the rate of change of (at a given , β) is significantly increased from the first to the second bout of repeated high-intensity exercise in seven subjects. B, as a result of the unchanged steady-state amplitude of in the two repeats, the time constant (τ) is also significantly reduced.