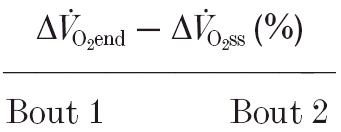
Table 5.
Magnitude of the  slow component of two repeated bouts of heavy-intensity exercise expressed as a percentage of the total amplitude
 |
Bout 2 – 1 difference (%Δ) | ||
|---|---|---|---|
| Subject no. | Bout 1 | Bout 2 | |
| 1 | 4.8 | 0.9 | −3.9 |
| 2 | 10.5 | 3.6 | −6.9 |
| 3 | 9.1 | 2.6 | −6.5 |
| 4 | 9.1 | 6.9 | −2.3 |
| 5 | 12.8 | 4.2 | −8.6 |
| 6 | 0.0 | 0.0 | 0.0 |
| 7 | 1.0 | 1.1 | 0.2 |
| Mean | 6.8 | 2.7* | −4.0 |
| S.D. | 4.9 | 2.4 | 3.5 |
Values for bout 2 are significantly different from bout 1.
