
Figure 4. Parameters of Po fluctuations.
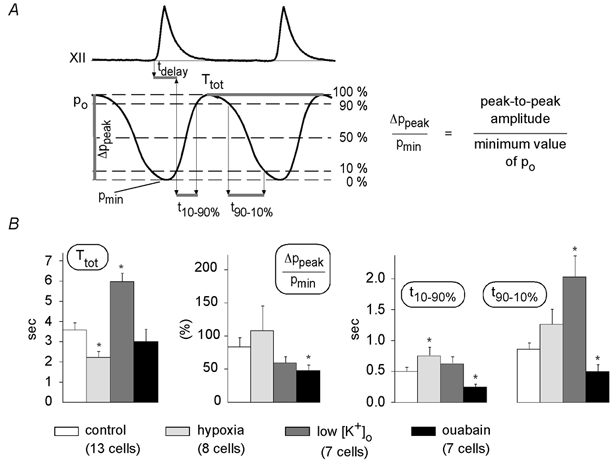
A, for a quantitative description of the changes in Po fluctuations, the following parameters were analysed: tdelay, the delay between onset of the rise of hypoglossal nerve activity and the 10 % point of Po; Ttot, the total duration of respiratory cycle; t10–90 %, the rise time from 10 to 90 % of peak amplitude; t90–10 %, the decay time from 90 to 10 % of peak amplitude; and ΔPpeak/Pmin, the maximum amplitude of Po fluctuations, which is always given as the percentage increase in Po. B, parameter ( ± s.e.m.) values were (at control conditions, hypoxia, low [K+]o and after ouabain application, respectively): Ttot 3.61 ± 0.33, 2.24 ± 0.28, 6.00 ± 0.40, 3.04 ± 0.59; t10–90 % 0.51 ± 0.06, 0.76 ± 0.14, 0.63 ± 0.11, 0.26 ± 0.04; t90–10 % 0.87 ± 0.11, 1.27 ± 0.26, 2.04 ± 0.34, 0.51 ± 0.11; ΔPo/Pmin 85 ± 14 %, 109 ± 37 %, 61 ± 9 %, 49 ± 8 %. A Mann-Whitney U test was performed to test for significant differences between control conditions and hypoxia, low [K+]o or ouabain. * Significant changes (P < 0.05). Interpretations of parameter values are discussed in the text.