
Figure 2. Validation of the glutathione assay conditions.
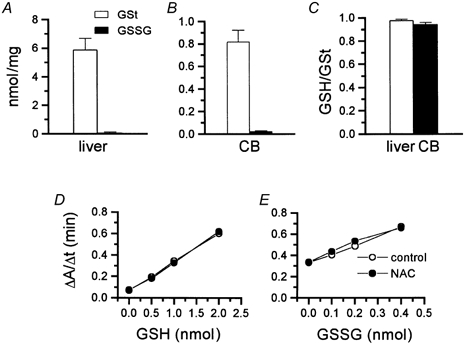
A and B, total (GSt) and oxidized glutathione (GSSG) levels in the rat liver and calf carotid body (CB), respectively. C, reduced to total glutathione (GSH/GSt) ratios in the rat liver and calf carotid body. D and E, standard curves for reduced (D) and oxidized (E) glutathione in control conditions and in the presence of NAC. Least-squares linear fitting for the GSt curves were: y = 0.27x + 0.07 for control and y = 0.27x+ 0.06 for NAC-containing samples (r2 > 0.99 in both cases). For GSSG curves the equations were: y = 0.85x+ 0.32 (r2 > 0.99) for control and y = 0.80x + 0.35 (r2 > 0.98) for NAC-containing samples. Assay mixtures consisted of 700 μl of a 0.3 mm NADPH solution prepared daily, 100 μl of a 6 mm DNTB solution stored at −20 °C in aliquots to be used in a given day, 200 μl of water minus sample volume (1–5 μl of supernatant, equivalent to 0.2–1.0 mg tissue, for GSt and up to 20 μl, equivalent to up to 4 mg tissue, for GSSG; blanks contained a volume identical to the sample volume of 4.31 % SSA) and glutathione reductase (1 unit and 5 units for GSt and GSSG assays, respectively). All reactants were dissolved in a phosphate buffer (0.125 mm; pH 7.5) containing EDTA at 6.3 mm.