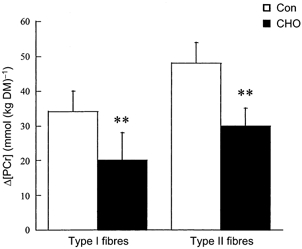
Figure 2. Changes (Δ values) in type I and type II muscle fibre PCr concentrations during submaximal running with (CHO) and without (Con) carbohydrate supplementation.

Values are means ± s.e.m.; n = 5. ** Significantly different from Con (P < 0.05).

Values are means ± s.e.m.; n = 5. ** Significantly different from Con (P < 0.05).