
Figure 5. Effect of CaP antisense loading on ERK and phospho-ERK protein levels.
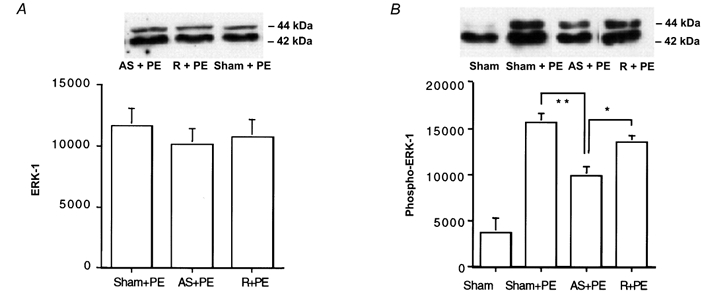
Upper panel, typical blot; lower panel, average densitometry results. A, the level of ERK (n = 8) in unstimulated muscles. B, the level of the PE-induced increase in phospho-ERK (n = 6). *P < 0.05, **P < 0.01 for antisense-loaded muscles compared to random sequence-loaded muscles and sham-loaded muscles. Values are protein matched and normalized to actin levels as determined by Naphthol Blue Black staining to correct for any differences in lane loading.