
Figure 2. The effect of TMS on soleus EMG activity during walking.
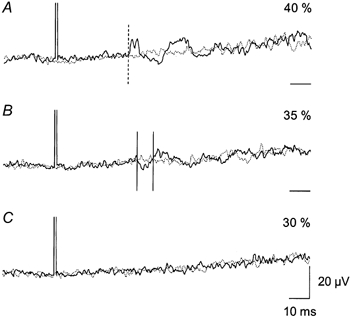
Same set-up as in Fig. 1. Each trace is the average of 150 sweeps of the rectified soleus EMG activity triggered 300 ms after heel contact. Continuous lines are EMG activity with magnetic stimulation and dotted lines are EMG activity without magnetic stimulation. The intensity of the magnetic stimulation is expressed as a percentage of maximum stimulator output: A, 40 %; B, 35 %; and C, 30 %. The MEP threshold was 50 % maximum stimulator output. The onset of facilitation is indicated in A by the vertical dashed line. The time window for measurement of the suppression is illustrated by the two vertical continuous lines in B. Time scale bars indicate the baseline (0 μV) for each trace.