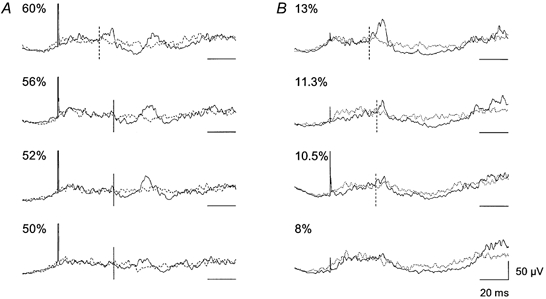
Figure 3. The effect of TMS vs. electrical transcranial stimulation on TA EMG activity during walking.

Continuous lines represent averages of sweeps (n = 100) with stimulation; TMS in A and transcranial electrical stimulation in B. Dotted lines represent averages (n = 100) of background EMG activity. The intensity of the stimulation as a percentage of the maximum stimulator output is indicated for each trace. Horizontal scale bars indicate the baseline level (0 μV) for each trace. The vertical dashed lines show the onset of the facilitation and the vertical continuous lines show the onset of the suppression.
