
Figure 4. All-order interval statistics in response to IRN, RPH and CPH stimuli as a function of stimulus period.
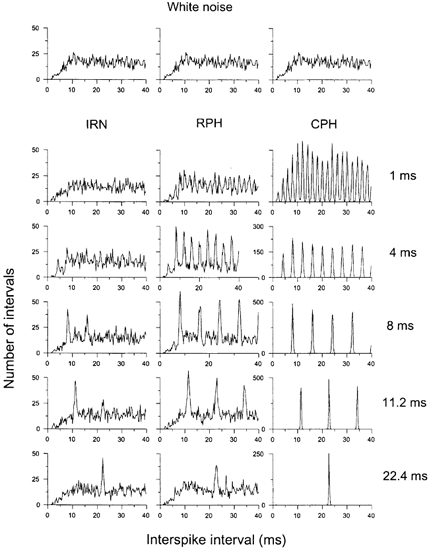
The unit was classified as an OC unit (211003) and had a best frequency of 11.2 kHz. The top row is the response to the equal energy WN stimulus; for comparison purposes it is shown in each column. Note the peak in the ISIH at the delay of the IRN stimuli (left column) and at the reciprocal of the delay for the RPH and CPH stimuli (middle and right columns).