
Figure 6. Normalized interval enhancement in an OC unit.
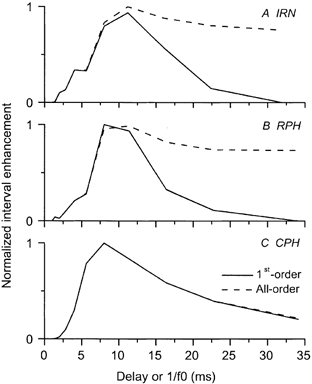
Interval enhancement of the OC unit shown in Figs 4 and 5 as a function of stimulus period. The continuous line indicates the interval enhancement based on first-order interval statistics; the dashed line represents the all-order interval statistics. For this unit there is a clear preference for periods around 11 ms in the first-order interval statistics for the IRN stimulus. A similar peak in the interval enhancement function is found around 100 Hz for the RPH and CPH stimulus conditions.