
Figure 7. Normalized interval enhancement in a CS unit.
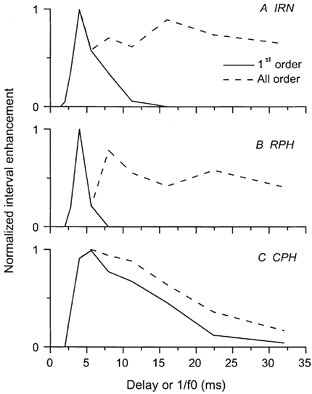
Best frequency was 3 kHz. Interval enhancement to IRN, RPH and CPH stimuli is shown in the first-order ISIHs (continuous line). The periodicity tuning was narrowest in response to the RPH stimulus and widest in response to the CPH stimulus. A more low-pass function is seen in the all-order statistics (dashed line).