
Figure 1. Elevation of [Ca2+]i by S1P in HUVECs.
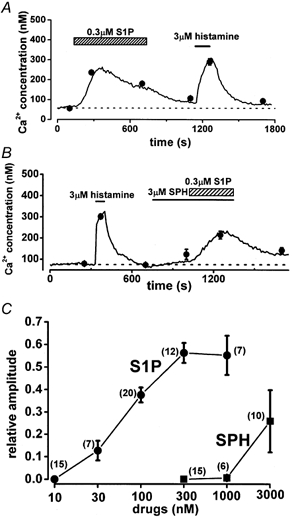
A, serial application of 0.3 μm S1P and 3 μm histamine to HUVECs that were loaded with fura-2. B, effect of SPH on [Ca2+]i in HUVECs and comparison with S1P-induced responses. The line shows the change in [Ca2+]i obtained from a representative cell, and the averages (•) denote responses from 10 separate cells. C, summarized data describing the concentration- response relationship for the S1P and SPH effects. The increase in [Ca2+]i induced by both compounds was normalized to that induced by 3 μm histamine and then plotted against concentration. Either S1P or SPH was applied once. Numbers in parentheses correspond to the number of cells studied.