
Figure 3. The effects of PTX on S1P-, histamine- and BHQ-induced Ca2+ responses in HUVECs.
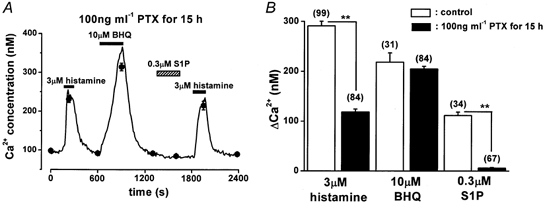
HUVECs were pretreated with 100 ng ml−1 PTX for 15 h. A, the line and filled circles show the change in [Ca2+]i obtained from a representative cell and the averages from 10 separate cells, respectively. B, summary of the effects of PTX. Numbers in parentheses show the number of cells studied. **P < 0.01.