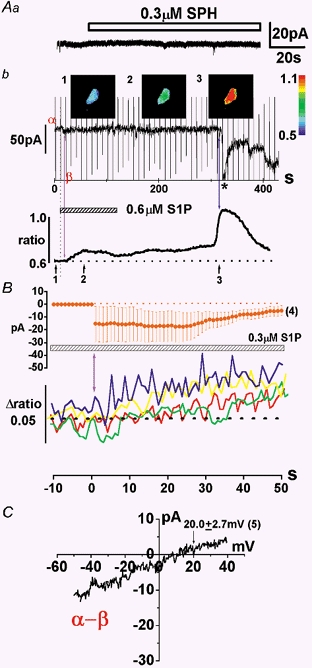
Figure 4. INSC activated by S1P in HUVECs.

Aa, 0.3 μm SPH, a negative control lipid, had no effect on membrane currents at a holding potential of -50 mV. Ab, this cell was voltage clamped at -50 mV while [Ca2+]i was monitored. The ramp waveform (0.96 V s−1) was applied every 10 s. Ab, the change in the holding current and the corresponding fura-2 signal (F340/F380 ratio) in the whole cell are plotted against time. The Ca2+ images indicated by 1-3 in the upper panel were taken at the times shown in the lower panel. Sampling frequency of Ca2+-imaging apparatus was 1 Hz. The calibration of fluorescence ratio is indicated by the colour scale on the right. B, summary of the onset of the elevation of [Ca2+]i and activation of IS1P. The onset time of IS1P was normalized to 0 s in four separate cells. The amplitude of IS1P at -50 mV was averaged in the upper panel and the corresponding change of fluorescence ratio is plotted against time in the lower panel. C, the current-voltage (I–V) relationship of INSC activated by S1P under the physiological experimental conditions. This I–V relationship was obtained by subtracting the net membrane current in the presence of S1P (β in Ab) from that in its absence (α in Ab).
