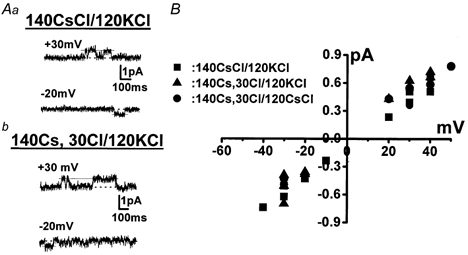
Figure 7. Current-voltage relationships of the NSC channel under various experimental conditions.

A, original current traces obtained when the pipette solution contained mainly 140 mm CsCl (a) and 30 mm CsCl with 110 mm caesium aspartate (b), respectively. The bathing solution contained 120 mm KCl and 20 mm TEA-Cl. The dotted line indicates the zero current level. B, current amplitudes plotted against applied potentials. The channel activity was recorded in the inside-out patch configuration. The conductance and the reversal potential were estimated by fitting the set of data under each experimental condition to a regression line (see text).
