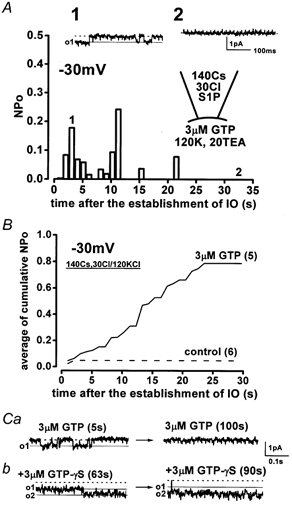
Figure 8. GTP-dependent activation of the NSC channel.

A, in the lower panel, NPo, which was calculated every 1024 ms, is plotted against time. The traces illustrated in the upper panel were obtained at the corresponding times indicated by ‘1′ and ‘2′ in the lower panel. S1P (0.3 μm) and GTP were present in the pipette and the bathing solution, respectively. B, summarized data describing the effect of intracellular GTP on the activity of NSC channels. The cumulative NPo in the presence and absence (control) of 3 μm GTP in the bathing solution was pooled, and the mean values were plotted against time after the establishment of the excised inside-out patch configuration. The numbers in parentheses indicate the number of cells examined. C, recovery of the NSC channel activity from run-down by application of 3 μm GTP-γS. The values in parentheses show the elapsed time after exposure of the patch to GTP and GTP-γS. o1 and o2 indicate the opening level of one and two channels, respectively. Throughout these experiments, the patch membrane was held at -30 mV. The pipette and external solution mainly contained 110 mm caesium aspartate and 30 mm CsCl, and 120 mm KCl and 20 mm TEA-Cl, respectively.
