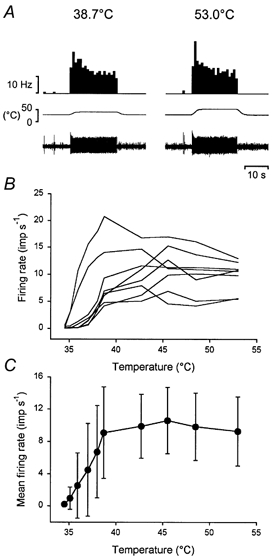
Figure 4. Warm neurones do not encode noxious heat stimuli.

A, pair of records from the same Warm neurone illustrating its response to an innocuous (38.7 °C) and a noxious (53.0 °C) heat stimulus. The traces are, from the top downward, firing rate of the unit in 1 s bins, temperature and the single-unit recording. B, individual stimulus-response curves for all 8 Warm neurones to innocuous and noxious heat stimuli. C, population stimulus-response curve (means ± 1 s.d.).
