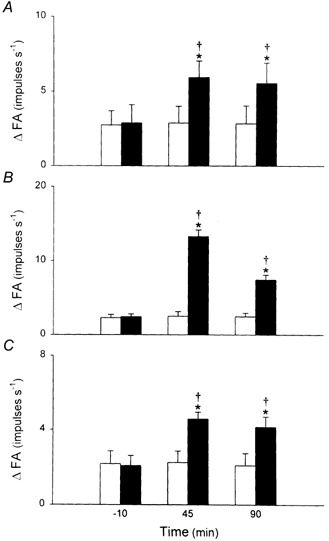
Figure 6. Time course of the effect of i.t. instillation of PLL on the response of pulmonary C fibres to three chemical stimuli.

A, responses to right arterial injection of capsaicin (0.5 μg kg−1). B, responses to phenyl biguanide (4 μg kg−1). C, responses to adenosine (0.15 mg kg−1). ΔFA was measured as the difference between the 2 s average at peak and the 10 s average at baseline in each fibre. The responses were determined at 10 min before, and 45 and 90 min after i.t. instillation of PLL (50 μg in 0.1 ml, ▪; n = 8) and vehicle (□; n = 6). Data are means ±s.e.m. *P < 0.05, significant difference between vehicle and 50 μg of PLL at any time point; †P < 0.05, significant difference between before and any time point after instillation of PLL or vehicle.
