
Figure 6. Dose-response curve for mexiletine block at a membrane potential equal toVh.
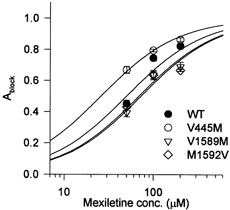
The Ablock for the WT and for each mutant is plotted against the concentration of mexiletine. The relationship was shifted to the left for mutant V445M and to the right for mutants V1589M and M1592V. The smooth curves show fits to the data with a single-site binding relation using the apparent dissociation constant (KApp). Symbols show means ±s.e.m. for n = 5-6 cells.