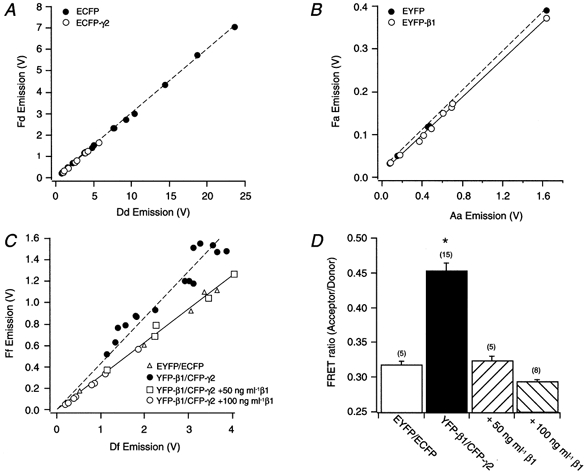
Figure 6. Calculation of FRET values in SCG neurons expressing ECFP, CFP-γ2, EYFP and YFP-β1.

Emissions recorded in SCG neurons expressing ECFP (filled circles) and Eβ1/CFP-γ2 (open circles; A), EYFP (filled circles) and EYFP-β1/γ2 (open circles; B) and EYFP/ECFP (open triangles), YFP-β1/CFP-γ2 (filled circles), YFP-β1/CFP-γ2 + 50 ng ml−1β1 (open squares) and YFP-β1/CFP-γ2 + 100 ng ml−1β1 (open circles; C). Emission values were determined as described in Methods. Dashed and continuous lines represent best fits to a straight-line equation. D, summary graph of mean (±s.e.m.) FRET values for neurons expressing EYFP/ECFP, YFP-β1/CFP-γ2, YFP-β1/CFP-γ2 + 50 ng ml−1β1 and YFP-β1/CFP-γ2 + 100 ng ml−1β1. *P < 0.01 vs. EYFP/ECFP-expressing cells. Numbers in parentheses indicate the number of experiments.
