
Figure 2. Effects of training and diet on arterial fatty acid (FA) concentration and net FA uptake across the leg.
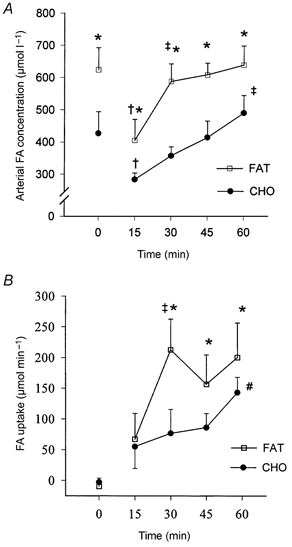
Arterial plasma FA concentration (A) and net FA uptake across the leg (B) at rest and during exercise after 7 weeks of training and adaptation to either a FAT (□) or a CHO (•) diet. Values are means ±s.e.m. *P < 0.05 compared to CHO; †P < 0.05 compared to rest; ‡P < 0.05 compared to 15 min values; #P < 0.05 compared to 30 min values.