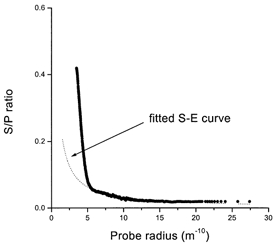
Figure 1. Secretion/perfusate (S/P) ratio as a function of radius.

The mean S/P ratio as a function of molecular radius (all experiments n = 12). The long tail from 0.6 nm (6 Å) upwards has been fitted to a Stokes-Einstein (S-E) curve (dotted line). For details see the Discussion and Fig. 7.
