
Figure 2. Substrate concentration dependence of rates of nucleotide binding and hydrolysis by myosin-S1.
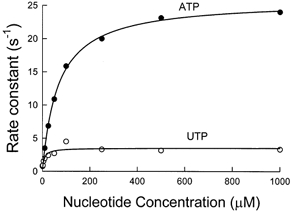
Hydrolysis was measured by tryptophan fluorescence, λexcitation= 295 nm and λemission= 330-380 nm. Rabbit skeletal myosin-S1 was mixed with substrate in a stopped-flow fluorimeter with a mixing volume ratio of 2:5 myosin-S1:UTP (○) or ATP (•). The plotted rate constants were obtained by fitting a single exponential function to the original fluorescence records (not shown). The curves fitted to the data are hyperbolae defined by ksat= 25 ± 1.1 s−1 (mean ±s.d.) and Kapp= 66.7 ± 3.1 μm for ATP and ksat= 3.5 s−1 and Kapp= 7.2 ± 0.3 μm for UTP. Experimental conditions in the flow cell were 1 μm myosin-S1, 150 mm KCl, 5 mm Mops, 2 mm MgCl2, pH 7, the indicated concentration of UTP or ATP, and 4 °C.