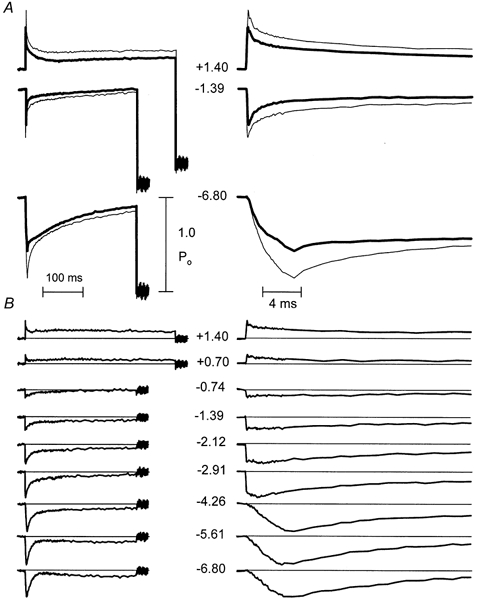
Figure 5. Transient tension responses to sudden changes of sarcomere length.

Records are the signal averages of records from 12 fibres. The size of the sarcomere-length step (in nanometres per half-sarcomere) is indicated by the numbers between traces (+ indicates stretch, - indicates release). Panels on the left display records on a slow time base, to show recording from the isometric period before the step to a period after the muscle was shortened rapidly to make the muscle go slack and zero the transducer. Note that stretches lasted longer than releases. Records on the right are displayed on a × 25 expanded time base to resolve the rapid events associated with the steps. A, representative pairs of records for same size steps in ATP (thick traces showing less deviation during the step) and UTP (thin traces) scaled to make isometric forces coincide and superimpose. B, difference between scaled pairs of records (UTP - ATP).
