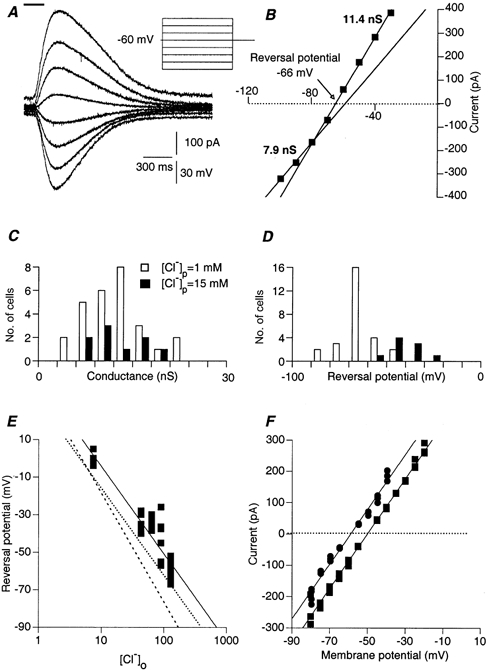
Figure 2. The GABA-induced current is carried by chloride and bicarbonate ions and mediated via GABAA receptors.

A, currents induced by 200 ms of local application of GABA (top bar). The currents were measured during 4 s-long voltage steps of various amplitudes. The concentration of chloride in the patch pipette was 1 mm. Note that the response elicited during the most depolarized voltage step is superimposed on a significant outward current. B, current-voltage relationships of the peak current responses shown in A. Two different linear relationships, which were found at two different voltage ranges (-30 to -70 mV and -80 to -100 mV), revealed two distinct conductance states. The values of the two conductance states were derived from the slopes of the linear regressions at the two voltage ranges. The reversal potential of the response was interpolated from the membrane potential where the current is zeroed (arrow). C, the distribution of the peak conductance measured in 27 neurones with 1 mm chloride in the patch pipette (open columns) and 9 neurones where 15 mm of chloride was used (filled columns). Mean values of 12.4 ± 4.6 nS and 12.2 ± 4.2 nS, respectively, were calculated (P > 0.4). D, the distribution of the reversal potential, measured as described for C. E, GABA reversal potential plotted as a function of the extracellular chloride concentration. Each data point represents a different neurone. Experimental results (▪) were fitted by a linear curve (continuous line) on a logarithmic scale. Dashed line, the expected relationship if chloride were the only charge carrier. Dotted line, the expected relationship when 81.5 % of the current was carried by chloride and 18.5 % by bicarbonate. Reversal potential of bicarbonate was taken to be -10 mV. Chloride concentration in the patch pipette was 5 mm. F, current-voltage relationships measured before (▪) and after (•) acetazolamide (50 μm) application.
