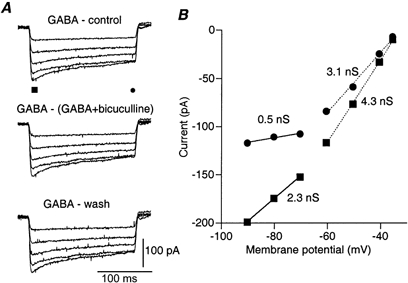
Figure 5. The response to bath application of GABA has the same properties as the response to local application.

A, net current responses to voltage steps induced by bath application of GABA. The traces are the result of subtracting the currents measured before GABA application (top panel), after washing out GABA (bottom panel) or in the presence of both 100 μm GABA and 40 μm bicuculline (middle panel) from the currents measured in the presence of 100 μm GABA. Note the time dependence of the decay of the response and its voltage dependence. The chloride concentration within the patch pipette was 15 mm and the reversal potential was -45 mV. B, current-voltage relationships measured at the peak (▪) and the end (•) of the current responses. The values of the apparent conductances derived from the slopes of the linear current-voltage relationships are given on the figure.
