
Figure 1. Native action potentials are approximated by ramp voltage protocols.
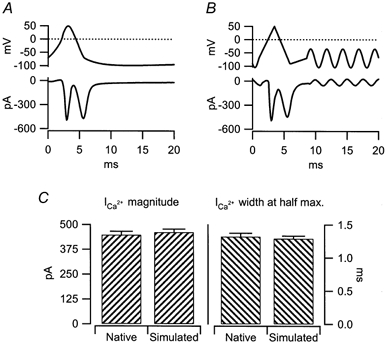
A, isolated chromaffin cells were held in the whole cell current clamp configuration and injected with 100 μs, 100 pA currents. The resulting action potential was measured and then utilised as a stimulus template in perforated patch voltage clamp recordings. The stimulus template (upper trace) and resulting evoked currents (lower trace) were measured and averaged from 100 stimuli in 4 cells (0.02 Hz). B, a 3-component ramp protocol was designed to mimic as closely as possible the native stimulus wave form presented in A. The ramp segments were as follows (start potential, end potential, duration): -70 mV, 50 mV, 2.5 ms; 50 mV, -90 mV, 2.5 ms; -90 mV, -70 mV, 2.52 ms. Again, evoked currents were measured and averaged in response to 100 stimuli in 4 cells (0.02 Hz). As in A, the stimulus template (upper trace) and evoked currents (lower trace) are plotted. C, the magnitude (left) and width at half-maximum current (right) of the Ca2+ influx measured in response to the native and simulated action potentials were quantified. Both measures were statistically identical between stimulus groups (Student's t test, P < 0.02).