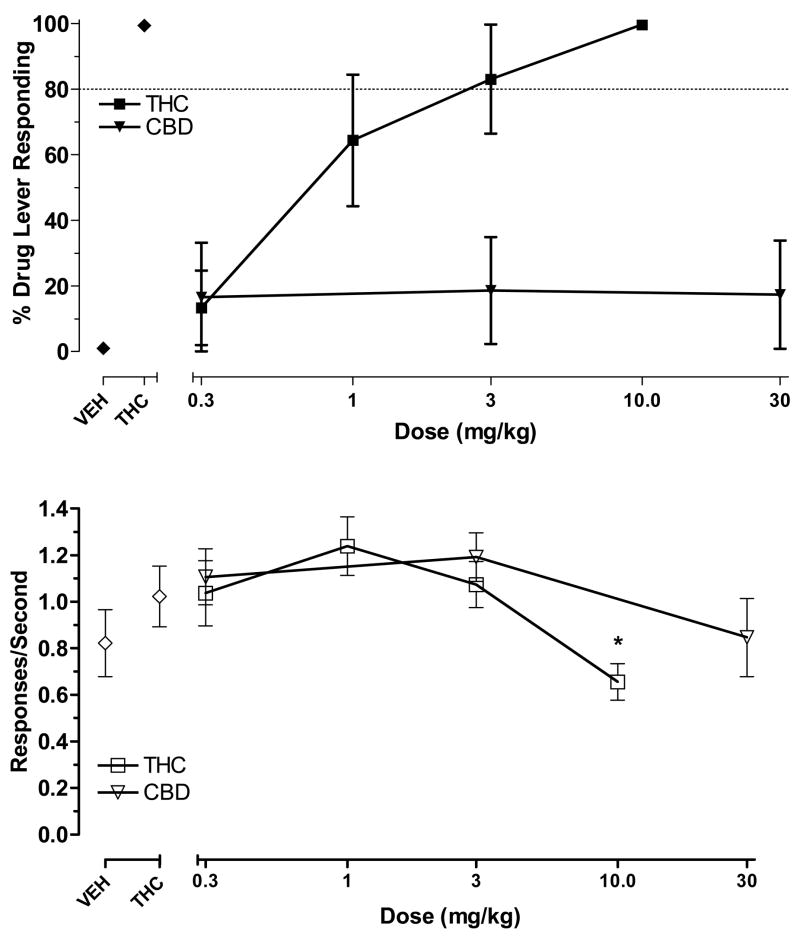
Figure 2.
Effects of CBD and THC on percentage of THC-lever responding (upper panel) and response rates (lower panel) in rats trained to discriminate 3 mg/kg THC from vehicle. Points above VEH and THC represent the results of control tests with vehicle and 3 mg/kg THC conducted before each dose-effect determination. For each dose-effect curve determination, values represent the mean (±SEM) of 6–7 rats.

