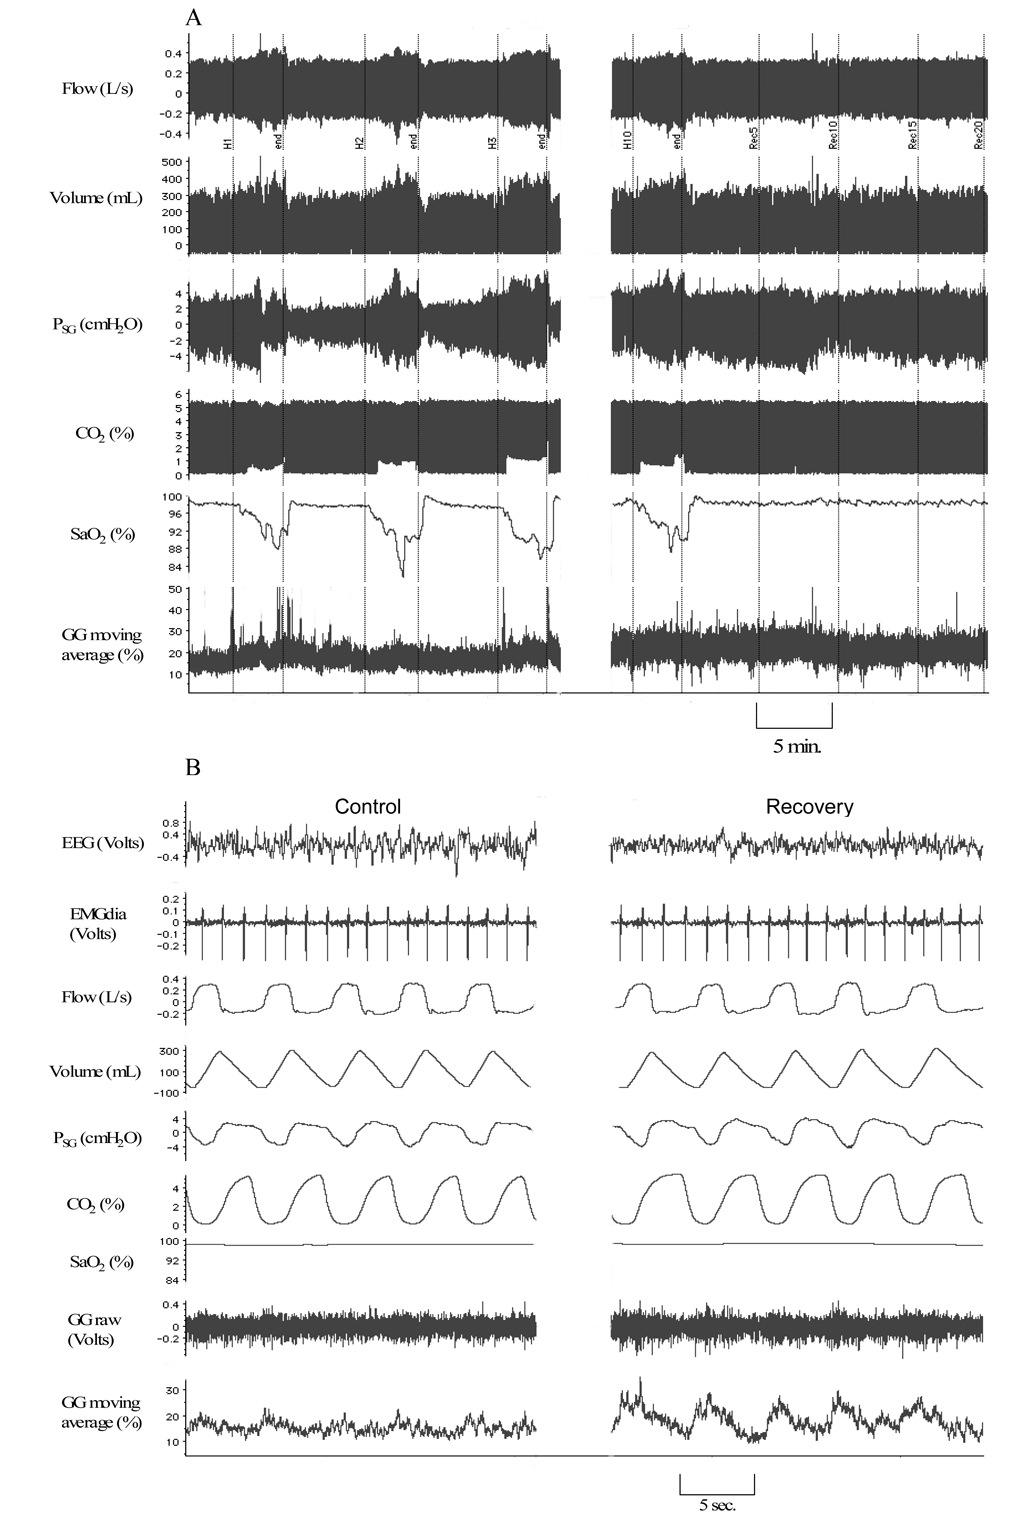
Figure 2.
Representative polygraph segments from a subject during stable NREM sleep at different time points: A. Compressed, high-speed polygraph segments during room air control condition, hypoxia periods (H1, H2, H3, H10) and recovery (R5, R10, R15 and R20). Note elevated phasic EMGGG amplitude during isocapnic hypoxia that persists during recovery relative to control; VT is increased during hypoxia alone. B. Polygraph at usual speed, for better visualization of EEG, EMGGG moving time average and EMGdia, clearly demonstrates increase in phasic EMGGG in during recovery period relative to control.

