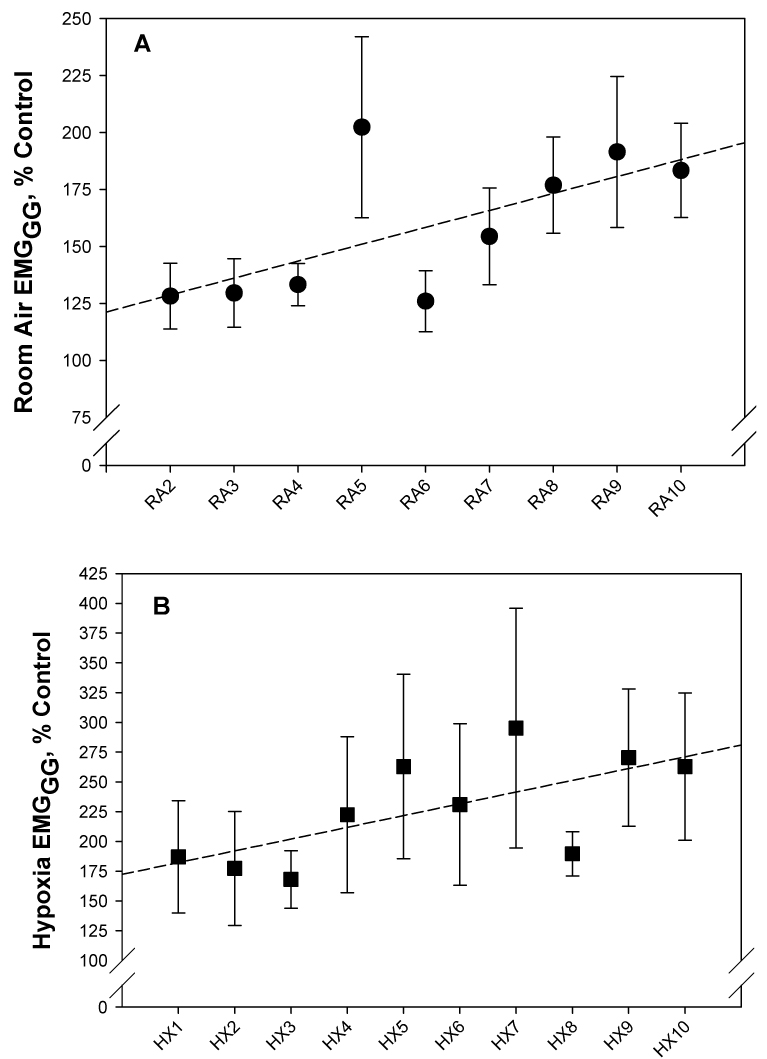
Figure 5.

Least square regression analysis: A. There was a gradual increase in the phasic EMGGG during the course of the room air control periods. The slope of the regression line was significantly different than zero (p<0.05) and illustrates the augmentation of LTF in the normoxic intervals between hypoxic episodes (RA2 to RA10). B. There was also a progressive augmentation of the EMGGG during successive hypoxia episodes (HX1 to HX10); slope of the regression line was significantly different than zero (p<0.05).
