
Figure 6.
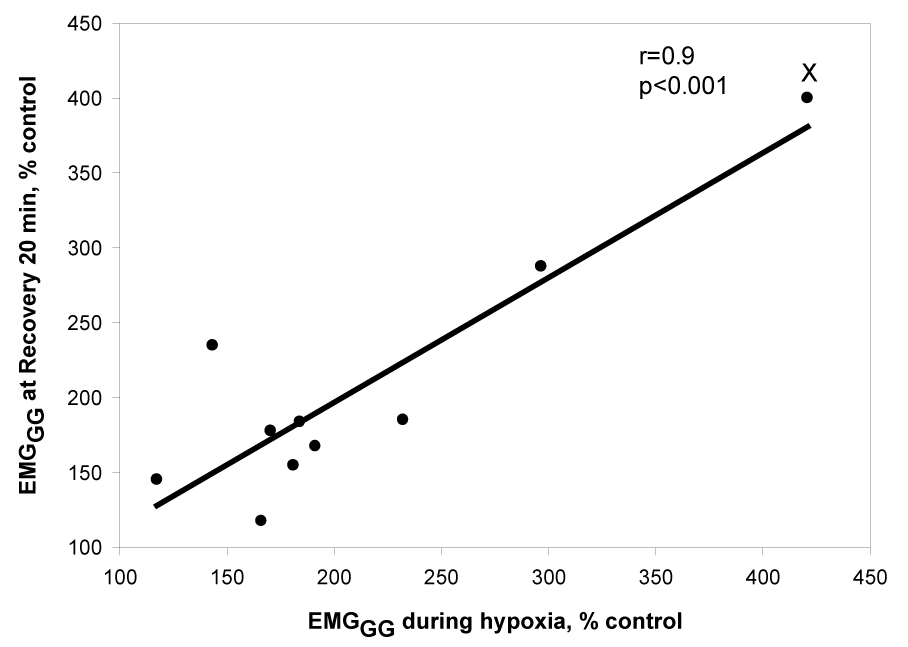
Demonstrates a significant positive relationship between phasic EMGGG (% control) during recovery at 20 minutes and phasic EMGGG (% control) during hypoxia. This correlation declined to r=0.6, p=0.06 after eliminating the highest right point (marked with X); but when adjusted for age in the multiple regression model, the coefficient of EMGGG during hypoxia was significant, see text for explanation.