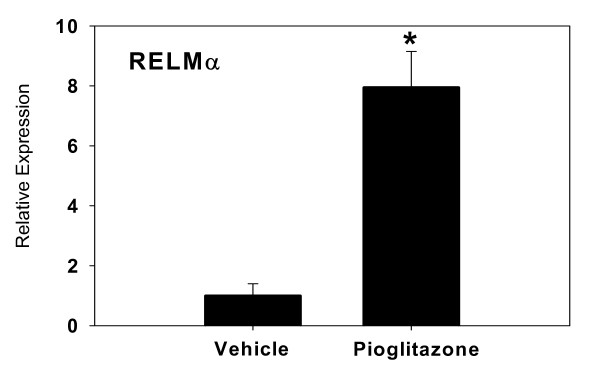
Figure 1.
Relative increase in expression of RELMα by Real Time RT-PCR. Bars represent mean ± SD, in relative gene expression calculated relative to endogenous GAPDH expression. An RNA concentration-response validation curve was carried out to determine the concentration of RNA to add to the RT-PCR reaction. All samples were run in duplicate, n = 3 animals per group.

