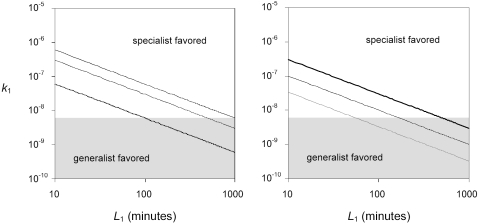
Figure 5. Optimal diet breadth given observed life history strategies in phages.
Lines depict the attachment rate and lysis time combinations at which generalist and specialist phages should achieve equal growth rates for particular host combinations and densities, as predicted by equation 7 (k 1 = x/[(1−x)L 1 N]). Here, we assume that the second best host is a proportion x as profitable as the best host, and specify a particular host density N. k 1 and L 1 represent the attachment rate and lysis time, respectively, of the most profitable host. Combinations above each line favor specialists; combinations below each line favor generalists. The shaded portion of the graph indicates the region over which phage life history traits have been observed. (A) Observed attachment rate and lysis times overlap the region that favors specialists only when host density is high. Here we fixed x = 0.75, and examined the cases where N = 5×10⁵ (solid line), 1×10⁶ (dashed line), and 5×10⁶ hosts/ml (dotted line). (B) Observed attachment rate and lysis times overlap the region that favors specialists only when differences in host profitability are large. Here we fixed N = 1×10⁶, and examined the cases where the second best host is 75% (solid line), 50% (dashed line), and 25% (dotted line) as profitable as the best host.

