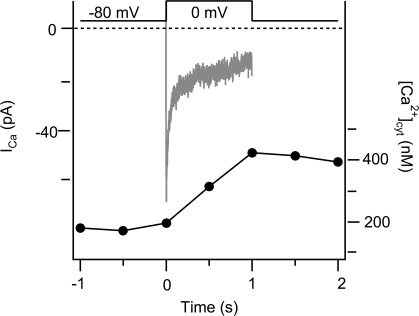
Figure 11.
Determination of κ in PC12 cells. Time courses of simultaneous fura-2 photometry and standard whole-cell recording used to determine κ in PC12 cells. Cytoplasmic Ca2+ (black line, left axis) and Ca2+ current (gray line, right axis) were monitored before and after depolarization from −80 to 0 mV for 1 s as described in Materials and methods. The black arrow marks the onset of the depolarization, and the gray arrow indicates the baseline for the current measurement. This result is typical of nine cells used for such experiments.

