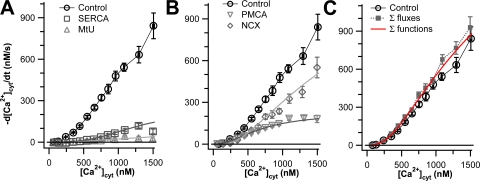
Figure 2.
Plasma membrane Ca2+ transporters have higher capacities than intracellular Ca2+ transporters in undifferentiated PC12 cells. Clearance rate, −d[Ca2+]cyt/dt, is plotted against [Ca2+]cyt for cells treated with 3-blocked protocols that allow only one transporter to work at a time. All gray data points are corrected for residual Ca2+ transport after 4-blocked experiments. Black curves represent data from control cells, as shown in Fig. 1 (n = 88). (A) Capacities of the intracellular transporters, SERCA (squares, n = 15) and MtU (triangles, n = 24). (B) Capacities of the plasma membrane transporters, PMCA (inverted triangles, n = 16) and NCX (diamonds, n = 16). (C) The sum of the four capacity (gray) curves in A and B plus the residual Ca2+ transport from Fig. 1 is compared with the control curve. The smooth curves superimposed on the gray data points of A and B and on the black points of C are calculated from the individual functions of a kinetic model with four canonical transport mechanisms and residual transport discussed in Appendix.

