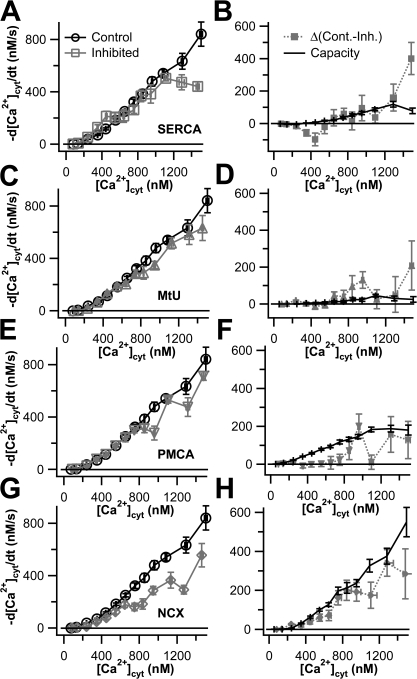
Figure 3.
Most Ca2+ transporters work at or near capacity in undifferentiated PC12 cells. In each panel of the left column (A, C, E, and G), Ca2+ transport curves from various 1-blocked experiments are shown in gray, and control Ca2+ transport curves from Fig. 1 (−d[Ca2+]cyt/dt vs. [Ca2+]cyt) are shown in black. In each panel in the right column (B, D, F, and H), the activity of a given transporter, calculated as the difference between the control Ca2+ transport curve and the 1-blocked Ca2+ transport curve to the left, is shown in gray. The capacity trace obtained from the 3-blocked experiments of Fig. 2 is shown in black. (A and B) SERCA was inhibited with 1 μM TG (n = 12). (C and D) MtU was inhibited by treatment with 2 μM CCCP (n = 16). (E and F) PMCA was inhibited by raising extracellular pH to 9.0 (n = 16). (G and H) NCX was inhibited by replacing extracellular Na+ with Li+ (n = 16).

