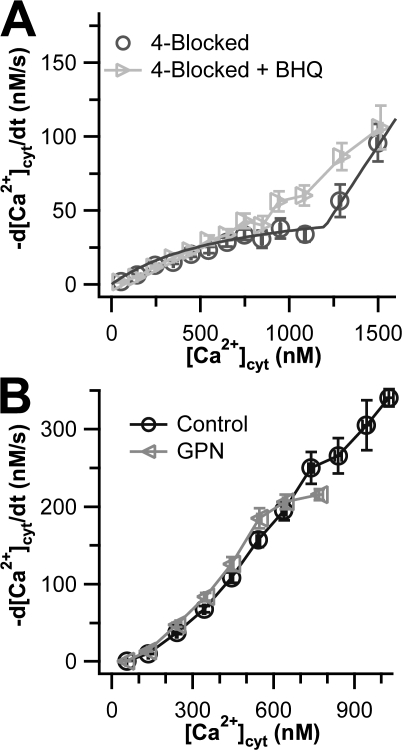
Figure 4.
Effects of BHQ and GPN on undifferentiated PC12 cells. Ca2+ transport curves (−d[Ca2+]cyt/dt vs. [Ca2+]cyt) are shown. (A) The light gray data points show cells treated with 10 μM BHQ in addition to the 4-blocked protocol (n = 15). The dark gray data points show residual transport in the 4-blocked cells of Fig. 1 with a superimposed smooth curve calculated from the residual transport function in a kinetic model discussed in Appendix. (B) The gray curve shows cells treated with GPN, whereas the black curve shows a truncated version of the control Ca2+ transport curve from Fig. 1.

