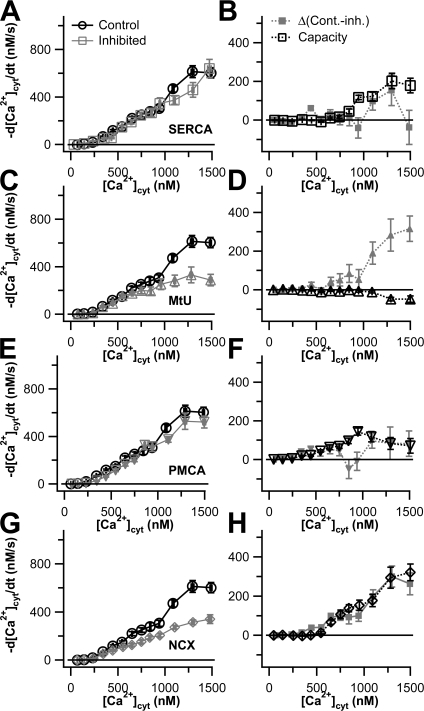
Figure 7.
Capacities and activities of Ca2+ transporters in NGF-differentiated PC12 cells. Results are shown as Ca2+ transport curves (−d[Ca2+]cyt/dt vs. [Ca2+]cyt). In the left column (A, C, E, and G), data from 1-blocked experiments for each of the four canonical Ca2+ transport mechanisms (gray lines and symbols) are compared with control NGF-differentiated cells (black lines and circles) from Fig. 6. In the right column (B, D, F, and H), the capacity of each transporter, obtained from 3-blocked experiments and corrected for residual Ca2+ transport, is shown in black. The activity of each Ca2+ transporter type, calculated as the difference between the two traces in the lefthand panel, is shown in gray: (A and B) SERCA (n = 33 for 1-blocked experiments, n = 17 for 3-blocked experiments); (C and D) MtU (n = 21 for 1-blocked experiments, n = 17 for 3-blocked experiments); (E and F) PMCA (n = 17 for 1-blocked experiments, n = 16 for 3-blocked experiments). (G and H) NCX (n = 19 for 1-blocked experiments, n = 16 for 3-blocked experiments).

