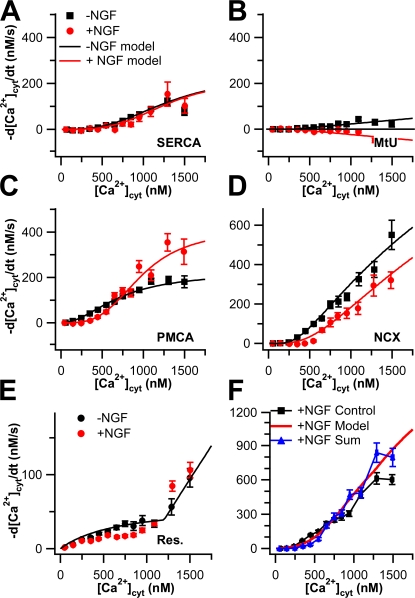
Figure 9.
Comparison of Ca2+ transport capacities between undifferentiated and NGF-differentiated PC12 cells. Experimental Ca2+ transport curves (−d[Ca2+]cyt/dt vs. [Ca2+]cyt) are shown as symbols. Black symbols are from undifferentiated cells and red symbols are from NGF-differentiated cells. Capacity data from undifferentiated cells are reproduced from Fig. 2. The capacity data for MtU and residual Ca2+ transport in differentiated cells are reproduced from Figs. 8 and 7, respectively. Smooth black and red curves represent fitted functions from the mathematical model in Appendix using the same color code. (A) Capacities and fits of SERCA. The NGF-differentiated points result from 2-blocked experiments where PMCA and NCX were inhibited, corrected for MtU and residual Ca2+ transport (n = 11). (B) Capacities and fits of MtU. (C) Capacities and fits of PMCA. The NGF-differentiated curve is the result of 2-blocked experiments in which SERCA and NCX were inhibited, corrected for MtU and residual Ca2+ transport (n = 16). (D) Capacities and fits of NCX. The NGF-differentiated curve points result from 2-blocked experiments in which SERCA and PMCA were inhibited, corrected for MtU and residual Ca2+ transport (n = 12). (E) Capacities and fits of the residual Ca2+ transport. (F) The NGF-differentiated control values (black) are shown with the sum of the five capacity curves from NGF-differentiated cells (blue) from A–E and the sum of the fitted functions (red).

