
Figure 2.
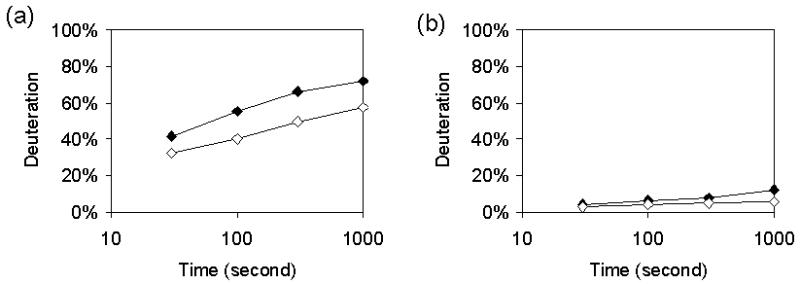
Representative data from fragments 113-134 containing residues in the C and D helices (left) and 195-200 (right). Graphs represent deuterium content of oxidized CYP-S (black) and reduced (white) CYP-S-CO as a function of time measured at 30, 100, 300, and 1000 s. Times are plotted on a log scale. Fragment 113-134 illustrates a significant difference in percent deuteration between oxidation states.