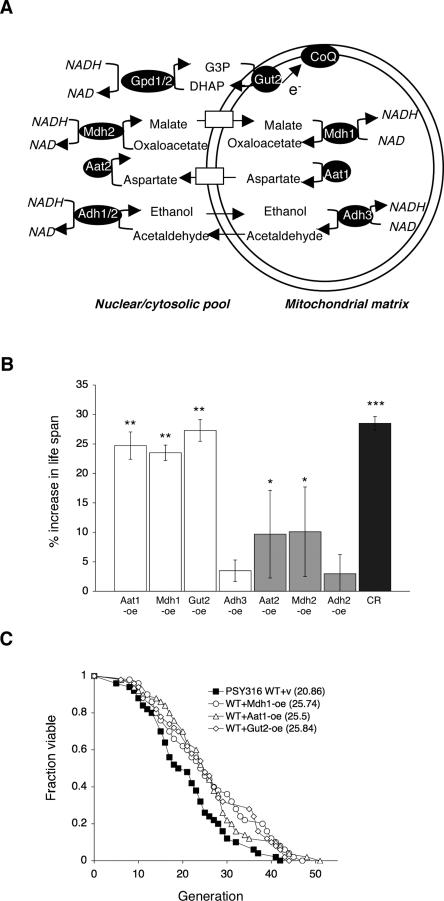
Figure 1.
Overexpressing components of the NADH shuttle systems extend life span. (A) Schematic presentation of the yeast NADH shuttle systems that balance the NAD/NADH ratio between the cytosolic and the mitochondrial pools. For example, in the case of the ethanol–acetaldehyde shuttle, an increase in the mitochondrial NAD/NADH ratio leads to the production of acetaldehyde through mitochondrial alcohol dehydrogenases (Adh3). Mitochondrial acetaldehyde diffuses freely to the cytosol, which is then reduced to ethanol via cytosolic alcohol dehydrogenases (Adh1/2), resulting in an increase in the cytosolic NAD/NADH ratio. In the malate–aspartate shuttle, an increase in the mitochondrial NAD/NADH ratio leads to the production of aspartate from malate through the malate dehydrogenase (Mdh1) and the aspartate aminase (Aat1). Aspartate is transported to the cytosol via the Agc1 carrier, which is then converted to malate by cytosolic malate dehydrogenase (Mdh2) and aspartate aminase (Aat2), resulting in an increase in the cytosolic NAD/NADH ratio. Cytosolic malate enters mitochondria though specific carriers. In the glycerol-3-phosphate shuttle, the mitochondrial glycerol-3-phosphate (G-3-P) dehydrogenase (Gut2) converts G-3-P to DHAP (dihydroxyacetone phosphate), resulting in an increase in the cytosoilc NAD/NADH ratio through the action of the cytosolic G-3-P dehydrogenases (Gpd1/2). Gut2 directly feeds an electron (e−) from G-3-P to coenzyme Q (CoQ), supporting electron transport chain activity. (B) Overexpressing components of the NADH shuttle systems extend life span. Life span analysis of the wild-type cells carrying a control vector and various overexpression DNA constructs. Percent increase in life span relative to wild-type control grown on 2% glucose media is shown. The results show the average of three independent experiments. Error bars denote standard deviations. P values were calculated using the Student’s t test. (*) P < 0.05; (**) P < 0.005; (***) P < 0.001. (C). Mdh1, Aat1, and Gut2 overexpressions also extend life span in a different strain background. Life span analysis of cells overexpressing Mdh1, Aat1, and Gut2 in the PSY316AR strain. One set of representative data is shown. (WT) Wild-type control; (CR) 0.5% glucose; (v) empty vector; (oe) overexpression.

