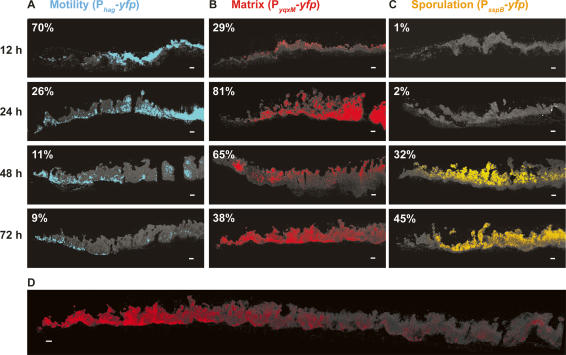
Figure 3.
Spatiotemporal analysis of differentiation within a biofilm. Vertical thin sections of biofilms harboring the indicated reporter fusions. (Left) Biofilms were frozen at the indicated times of development prior to cryosectioning and fixation. Images represent only partial colonies approximately encompassing the region magnified in Figure 1B. The edge of the colony is shown at the left of the image, the agar surface is at the bottom. Transmitted light images (cells appear gray on the black background) were overlaid with fluorescence images that were false-colored blue for motility (A), red for matrix production (B), and orange for sporulation (C). The percentage of fluorescent cells was obtained by flow cytometry, and is indicated in the top left of each image. Percentages represent the average obtained from three independent experiments. (D) Image of 72-h thin section from B encompassing the edge to the center of the colony. Bars, 50 μm.

