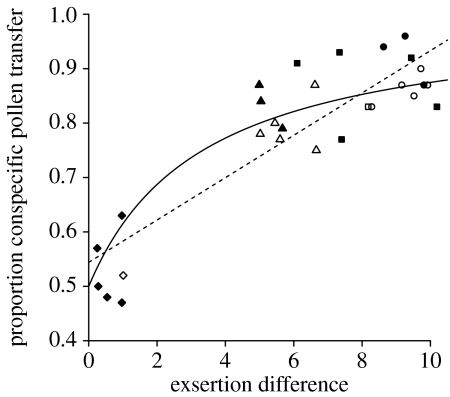
Figure 3.
The proportion of conspecific pollen deposited by each bat in each experiment graphed against the average difference in exsertion length for the experiment. The four experimental treatments are marked by diamonds (B. sodiroana and B. ceratocarpa), triangles (B. sodiroana and B. cylindrocarpa), squares (B. sodiroana and B. borjensis) and circles (B. sodiroana and B. succulenta). Filled symbols, A. caudifer individuals; open symbols, A. geoffroyi individuals; dashed line, the linear regression (y=0.0389x+0.5441; R2=0.78, F=90.7, p<0.0001); solid line, the best-fit function (y=(ax+1)/(ax+2), with a=0.5985; see §2).

