
Fig. 2.
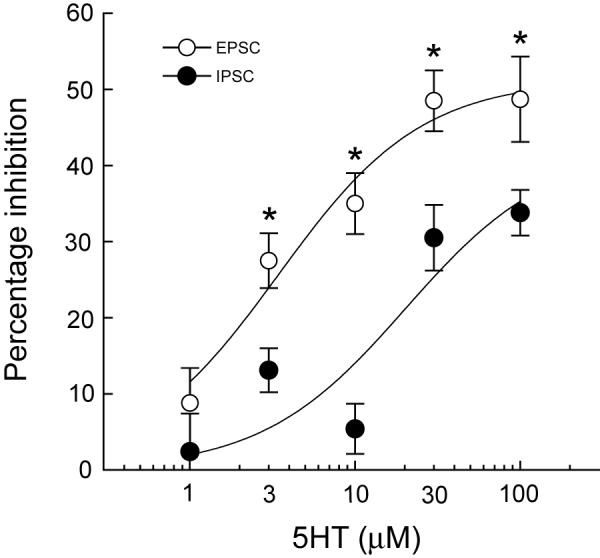
Concentration-response curves for effects of 5HT on EPSCs and IPSCs. 5HT is more potent for inhibiting EPSCs (IC50 = 3.4 μM) compared to inhibiting IPSCs (IC50 = 20.2 μM). Asterisks indicate significant differences based upon 2-way ANOVA and Tukey multiple comparison tests (P < 0.05). Each data point represents the mean ± SEM of 3 - 19 cells.