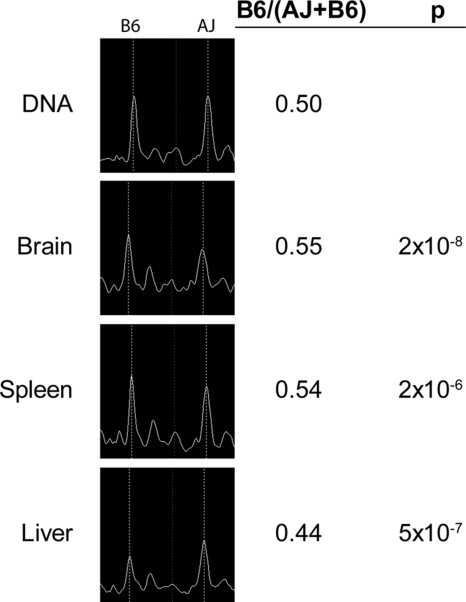
Figure 3.
Example of tissue-specific allelic imbalance in Emilin2. Representative spectra of a transcribed SNP assayed in F1 genomic DNA and cDNA from three tissues. The peak locations for the A/J and B6 alleles are marked. For this gene, the B6 allele peak is higher than the A/J allele peak in brain and spleen, but the A/J allele peak is higher than the B6 peak in liver.

