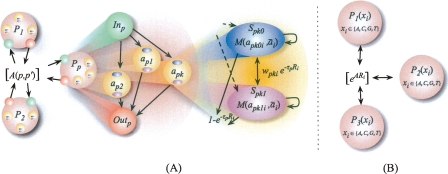
Figure 1.
(A) Hierarchical HMM state diagram for HAPAA. On the left, inter- and intra-population transitions occur with probabilities governed by matrix A(p, p′). In the middle, each population Pp has a similar structure: entry state Inp transitions with uniform probability to a diploid model individual apk, then to exit state Outp. On the right, in apk we transition into one of two states representing the haplotypes Spk0 and Spk1 of model individual apk with equal probability. Each haplotype emits its alleles apkhi via a mutation/error probability distribution M(apkhi, ai). Haplotypes transition to each other with probability proportional to the phase switch error Wpki, and transition out of the diploid sample with probability governed by genetic distance to the next locus Ri and the population-specific recombination rate parameter τp. (B) HMM state diagram for previous methods. Each state represents a population and emits alleles according to frequency estimates for the populations, and admixture transition probabilities depend on the degree of admixture expected and other learned parameters. By construction, these methods assume a greater degree of independence between adjacent loci.

