Figure 1.
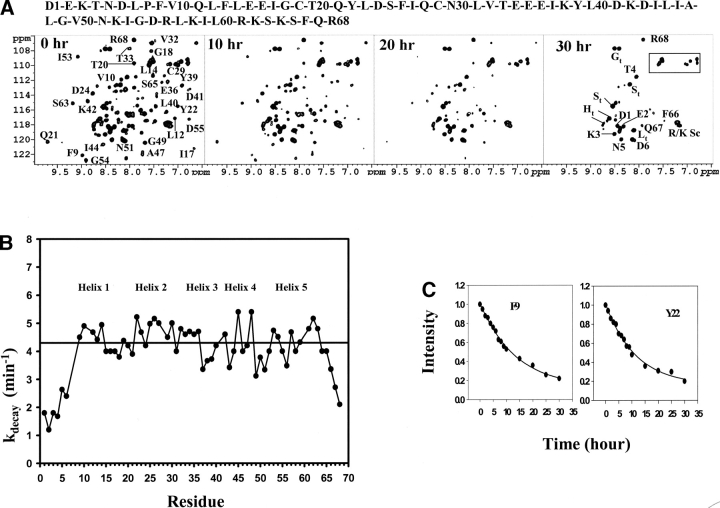
(A) 1H-15N HSQC spectra of the Ste11 SAM at pH 5.0 showing time dependent disappearance of the 1H-15N cross-peaks. The spectra were acquired immediately after changing pH to 5.0 in a buffer solution of 10 mM potassium phosphate containing 5 mM β-mercaptoethanol at a temperature of 288 K. Only partial assignments are shown for clarity purposes on the 0 h HSQC spectrum. The box indicates amide (NH2) side-chain resonances of Asn and Gln residues. Some cross-peaks that arise from the amino-terminal tag are assigned and subscripted with t as shown in the 30 h HSQC spectrum. The concentration of the Ste11 SAM domain was fixed at 0.5 mM. (B) Plot of the decay constants (kdecay/min) as a function of the residues of the Ste11 SAM domain estimated from the time-dependent loss of 1H-15N HSQC signals at pH 5.0. The bar indicates the average decay constant that has been calculated from the residues in the structured regions of the SAM domain. The decay constants were measured by fitting the intensities of the HSQC peaks for individual residues into a single exponential equation. The decay curve and fitting are shown for two representative residues (C). The amino acid sequence of the Ste11 SAM domain is shown on the top. Positions of the helical secondary structures are shown in (B).

