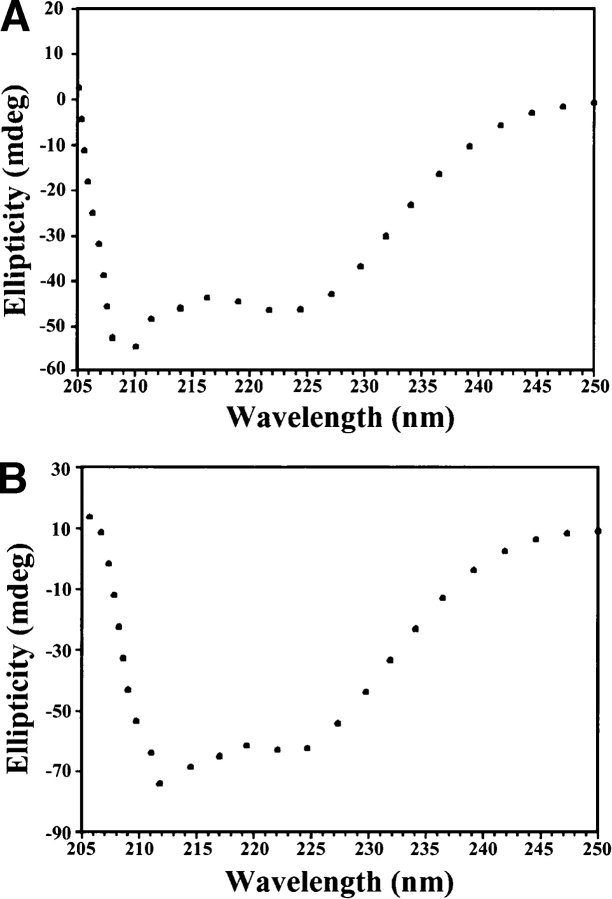
Figure 2.
Far UV-CD spectra of the Ste11 SAM domain in (A) the dimeric state at pH 5.8 and in (B) the polymeric state at pH 5.0. (C) AFM images and (D) section analysis of the polymeric state of the Ste11 SAM domain formed at pH 5.0. Sample concentrations for AFM experiments were the same as those used for far UV-CD, as detailed in Materials and Methods.


