
Figure 3.
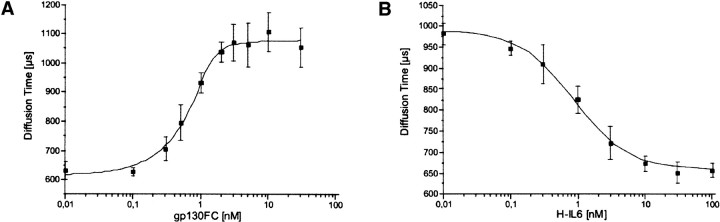
Fluorescence correlation spectroscopy (FCS). (A) Titration of the labeled Hyper-IL-6 with increasing concentrations of sgp130Fc, FCS Analysis 1-component fit, measurement time 5 × 30 sec, determined KD = 0.06 nM. (B) Competition titration with varying concentrations of unlabeled Hyper-IL-6 (1 nM sgp130Fc, 0.5 nM labeled Hyper-IL-6), FCS Analysis 1-component fit, measurement time 5 × 30 sec, determined IC50 = 0.86 nM.