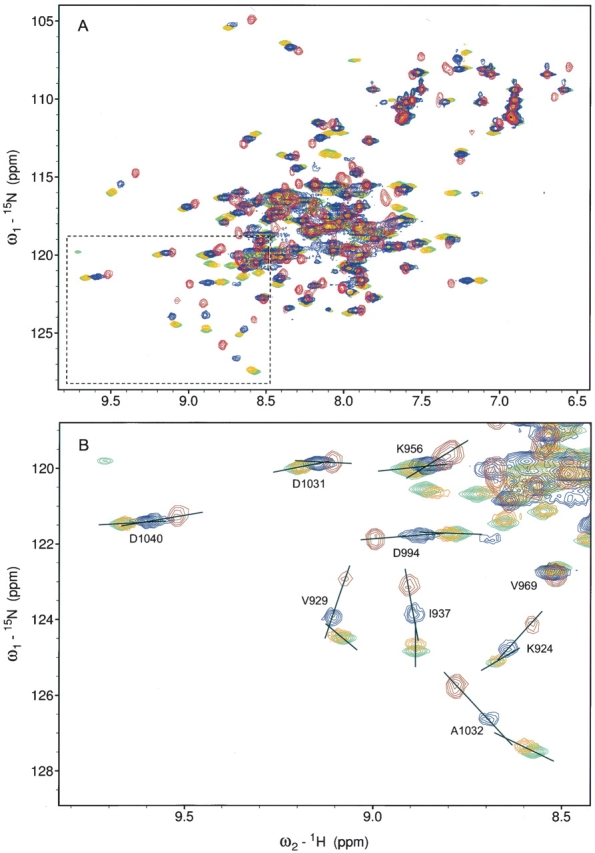
Figure 1.

HSQC map of LD2 titration into a solution containing the FAT domain. (A) Overlaid HSQC spectra of the FAT domain (red), FAT with 1 eq of LD2 (blue), FAT with 2 eq of LD2 (orange), and FAT with 10 eq of LD2 (green). (B) Expanded region in A shows changes in the direction of the chemical shifts indicating a secondary binding event.
